
Understanding Level 2 data can feel overwhelming at first. Many traders struggle to make sense of all the numbers, colors, and constant updates on their screens. If you’ve ever felt confused by bid prices, ask prices, or order books, you’re not alone.
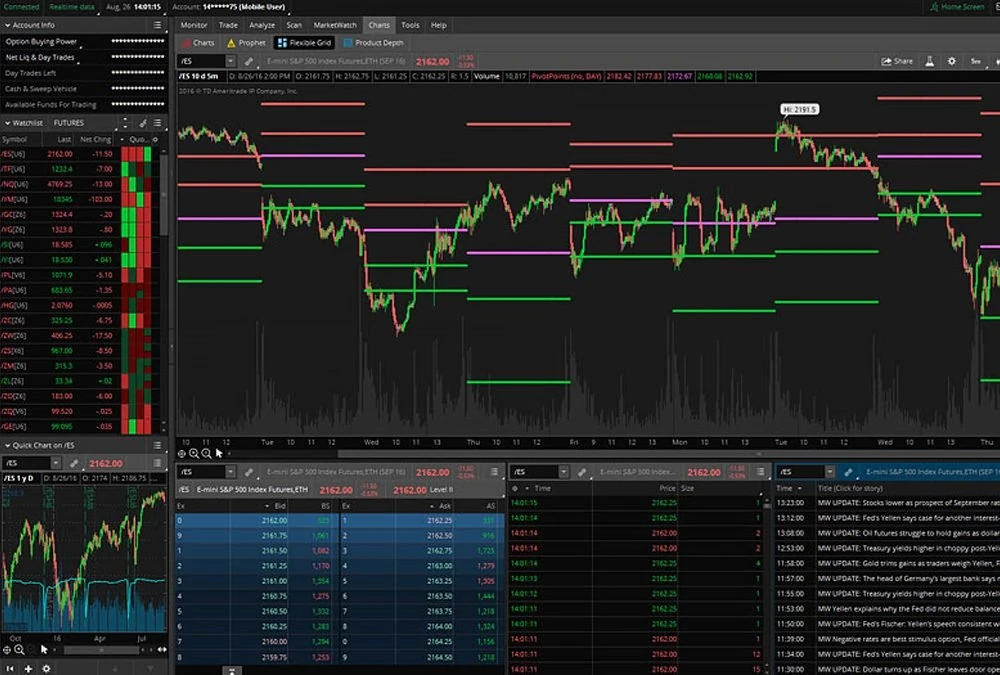
Thinkorswim Level 2 data provides detailed insights into market activity. It shows real-time quotes from buyers and sellers along with their price levels and trade sizes. This information helps traders identify trends, monitor liquidity, and refine their timing.
In this guide, you’ll learn how to interpret Thinkorswim’s Level 2 data effectively. You’ll find out what each section means and how it can assist your trades. Keep reading for tips that could shift how you perceive the markets!
Level 2 data provides deeper insights into market activity beyond basic quotes. It displays detailed price levels and order information for accurate trading decisions.
What Level 2 Data Reveals
Level 2 data provides detailed information about market depth and trade activity. It includes a complete list of all buy (bid) and sell (ask) orders at various price levels. Traders can view the highest bids, lowest asks, and the number of shares available for each order.
This clarity assists traders in assessing market sentiment and liquidity in real-time.
Order books show active orders placed by participants such as retail traders, market makers, or institutions. “Market makers manage price movement through bid-ask spreads to maintain liquidity,” said an experienced trader.
By studying this data on Thinkorswim’s platform, users can anticipate short-term price action more accurately and organize their trades with precision.
Key Components: Bid, Ask, and Order Book
The bid represents the highest price a buyer is prepared to pay for a stock. The ask indicates the lowest price a seller is ready to accept. Together, they form the bid-ask spread, which assists in gauging market liquidity and transaction costs.
The order book presents real-time data on buy and sell orders at various price levels. Buyers’ bids are listed on one side, while sellers’ asks are on the other. This resource enables traders to evaluate supply, demand, and possible future price movements effectively.
Players in the Marketplace
The stock market has different participants who influence price movements. Understanding these key players helps you anticipate how orders might affect the market.
Market Makers (MM)
Market Makers (MM) play an essential role in maintaining market fluidity and efficient trade execution. They establish buy and sell orders at various price points, keeping the order book active.
Their main objective is to connect buyers with sellers while earning profits from the bid-ask spread.
These participants frequently maintain significant inventories of stocks or other securities. They consistently offer real-time quotes for bids and asks, ensuring minimal delays in transactions.
By doing so, they help reduce price fluctuations and assist traders in executing market orders effectively, even during periods of high trading activity.
Electronic Communication Networks (ECN)
Market makers play a vital role, but ECNs add another layer of clarity. ECNs connect buyers and sellers directly without intermediaries. They match limit orders from traders looking to buy or sell at specific price levels.
“ECNs enhance order execution speed and display real-time quotes in the market.”
These networks allow traders access to the order book, where they can see bid and ask prices. Popular ECNs include ARCA and EDGX, commonly visible on platforms like Thinkorswim.
How to Interpret Level 2 Data on Thinkorswim
Level 2 data shows detailed insights into market activity and price movements. Analyze the changes in order sizes and positions to predict potential shifts.
Tracking Liquidity and Order Flow
Tracking liquidity and order flow assists traders in understanding market activity. It highlights opportunities by showing real-time changes in buy and sell orders.
- Observe the bid and ask sizes to estimate interest at specific price levels. Larger sizes indicate strong buying or selling interest.
- Keep an eye on shifts in the order book to identify where orders accumulate or decrease. Sudden changes may indicate potential price movement or hesitation in the market.
- Review the spread between bids and asks for insights into market liquidity. A narrow bid-ask spread suggests high activity, while a wide spread signals low liquidity or uncertainty.
- Detect large market orders that can move prices quickly. These signify aggressive buyers or sellers acting on their positions urgently.
- Pay attention to volume analysis to measure how much supply and demand exist around key levels. Higher volumes often strengthen support or resistance levels during trading sessions.
- Monitor recurring patterns in order flow, such as repeated actions from specific players like market makers, which can point to possible trends.
- Be vigilant for canceled orders or rapid bids that appear briefly (spoofing). These might be attempts to mislead other traders about actual interest in a stock.
- Notice trades executed at hidden prices outside the visible bid-ask ranges on the screen—this could indicate unadvertised larger movements by institutional investors.
Recognizing Patterns in Bid/Ask Levels
Recognizing patterns in bid/ask levels can help traders identify market trends. These patterns often signal buying or selling pressure and guide smarter trading decisions.
- Observe the size of the bids and asks. Larger bid sizes may show strong buying interest, while larger ask sizes may indicate higher selling pressure.
- Look for stacked orders on one side of the order book. A cluster of high bids or asks can signal potential support or resistance levels.
- Pay attention to rapid changes in bid/ask sizes. Quick increases in either side might reflect shifts in demand or supply.
- Notice if bids consistently move upward or downward. Rising bids suggest buyers are willing to pay more, while falling bids may show a decline in buyer interest.
- Watch for small spreads between the bid and ask prices. Tight spreads often point to a balanced market with high liquidity.
- Identify cases where large orders get split into smaller chunks. This technique is sometimes used by experienced traders to conceal their true intentions from others.
- Spot orders that suddenly cancel before execution. Market players might use this tactic to create false impressions of supply or demand.
Grasping these cues will equip you to combine Level 2 Data with Time and Sales efficiently next.
Tips for Using Level 2 Data Like a Pro
Pay close attention to large orders and their placement in the order book. Watch for sudden changes in bid/ask sizes to anticipate market moves.
Identifying Buying and Selling Pressure
Watch the bid and ask sizes closely to identify buying or selling pressure. Larger bid sizes compared to the ask suggest strong buying interest at that price level. Conversely, bigger ask sizes signal higher selling pressure, as more traders aim to sell their positions.
Keep track of how quickly orders get completed on either side of the order book. Quickly completed bids may indicate determined buyers are entering, moving the market higher. If asks disappear fast, sellers dominate and could lead lower prices.
Spotting Hidden Orders and Deception
Traders often try to conceal large orders by dividing them into smaller parts, making their intentions less visible. This approach can give misleading impressions of market liquidity and demand in the order book.
For example, a single large buy order might look like multiple small ones at various price levels.
Market makers may also use deceptive orders, known as spoofing, to influence price movement. They place large bids or offers they do not plan to execute, misleading others into responding.
Identifying these patterns requires closely observing how quickly orders vanish or adjust when prices change.
Combining Level 2 Data with Time and Sales
Analyze how trade activity aligns with Level 2 data to identify changes in momentum. Monitor real-time transactions to validate trends or identify irregularities.
Reading the Tape for Better Insights
Reading the tape involves analyzing real-time trade data. It enables traders to interpret market sentiment and activity at each price level.
- Observe price and volume changes in real-time quotes. Look for sudden increases to identify shifts in buying or selling pressure.
- Watch the speed of transactions on the trading interface. Faster trades often indicate high interest or market momentum.
- Focus on large orders in the order book. These can suggest institutional activity or strong support/resistance levels.
- Track repeated patterns in bid/ask spreads. Narrowing spreads may imply heightened competition among traders, while widening spreads could indicate uncertainty.
- Use color codes for better clarity on executed trades. Colors often show whether a transaction occurred at the bid or ask price, reflecting buying or selling strength.
- Pay attention to unusual trade sizes that differ from average volumes. This might reveal hidden motives, like iceberg orders or strategic positioning.
- Check how trades react near key technical indicators like moving averages or trendlines on charting tools. This provides additional perspective alongside tape reading insights.
- Combine tape reading with volume analysis for clearer indications of liquidity and market depth activity at specific price levels.
Using Color Codes to Analyze Trades
Thinkorswim’s color codes assist traders in easily recognizing trade types and market trends. Green typically signifies buying activity, with trades executed at the ask price or higher.
Red usually denotes selling pressure, showing trades completed at the bid price or lower.
Yellow can indicate neutral trades that occur between bid and ask levels. Bright colors may emphasize high-volume transactions or specific order imbalances. Recognizing these differences helps traders monitor real-time data and identify changes in market liquidity with enhanced accuracy.
Combine this tool with Time and Sales for improved technical analysis of volume and order flow patterns.
Conclusion
Mastering Level 2 data on Thinkorswim gives traders a clear advantage. It shows market depth, order flow, and price levels in real-time. Apply this information to track trends and make better decisions.
Pair it with time and sales tools for more thorough insights. With practice, you can recognize patterns like a professional!
Raghav is a talented content writer with a passion to create informative and interesting articles. With a degree in English Literature, Raghav possesses an inquisitive mind and a thirst for learning. Raghav is a fact enthusiast who loves to unearth fascinating facts from a wide range of subjects. He firmly believes that learning is a lifelong journey and he is constantly seeking opportunities to increase his knowledge and discover new facts. So make sure to check out Raghav’s work for a wonderful reading.